Back to: Biology 112 Syllabus
Back to: Biology 112: Evolution and EcologyHome Page
Back to: Kenyon College Biology Department
Human domination of earth's ecosystems. 1997. Science 277: 494-499. by Peter Vitousek et al. and you can find a copy of the paper here
In no more than 1 paragraph, single spaced, comment on the following statement: The authors call for research to further understand Earth's ecosystems and how they work. Do you feel this is a productive strategy in combating global change? Why or why not?
Note - the second exam is next Monday, November 3!
USEPA web site on global warming.
Intergovernmental Panel on Climate Change web site.
Our Topic:
Global Change refers to 3 distinct phenomena, each of which is discussed below. These include:
- changing atmospheric chemistry
- changes in biogeochemical cycles
- changing land-use patterns.
Where do we begin? An Early History of an International Scientific Consensus on Global Warming (from Environmental Defense):
1896: Arrhenius, a Swedish chemist, advances the theory that carbon dioxide
emissions from combustion of coal would enhance Earth's greenhouse effect and
lead to global warming.
1924: Based on 1920 coal use, Lotka, a U.S. physicist, speculates that
industrial activity will double atmospheric CO2 in 500 years.
1949: Callendar, a British scientist, speculatively links the estimated 10%
increase of atmospheric CO2 between 1850 and 1940 with the observed warming
of northern Europe and North America which began in the 1880's.
1954: Hutchinson, a Yale biologist, first suggests that deforestation will increase
atmospheric CO2 .
1957: Revelle and Seuss, scientists with the Scripps Institute of Oceanography,
report for the first time that much of the CO2 emitted to the atmosphere is not
absorbed by the oceans, as some had argued, leaving significant amounts in the
atmosphere which could eventually warm the Earth. They call carbon dioxide
emissions "a large-scale geophysical experiment" with Earth's climate.
1958: Keeling, a scientist with the Scripps Institute, begins the first reliable and
continuous measurements of atmospheric carbon dioxide at Hawaii's Mauna Loa
Observatory. Keeling finds CO2 concentrations to be 315 parts per million and
rising.
1967: The first reliable computer simulation calculates that global average
temperature may increase by more than 4 degrees Fahrenheit when the
atmospheric CO2 level doubles that of pre-industrial times.
On to today: what evidence do we have for changing atmospheric chemistry?
- increase in CO2 concentrations from 280 uL/L (0.028%) to about 365 (0.0365%) uL/L from 1800 to today
- we are fortunate to have a remarkable data set from Mauna Loa observatory. When considering this data set ask yourself two questions: 1) why the seasonal oscillations, and 2) why is the location of this sampling station important?

Air samples at Mauna Loa are collected continuously from air intakes at the top of four 7-m towers and one 27-m
tower. Four
air samples are collected each hour for the purpose of determining the CO2 concentration. Determinations of CO2
are made by
using a Siemens Ultramat 3 nondispersive infrared gas analyzer with a water vapor freeze trap. This analyzer registers
the
concentration of CO2 in a stream of air flowing at ~0.5 L/min. Every 20 minutes, the flow is replaced by a stream
of calibrating
gas or "working reference gas".
Other greenhouse gasses exist and have also increased in concentration. These include CH4 (methane)
and N2O (nitrous oxide). As a greenhouse gas, methane is about twenty times as effective in trapping
heat on a molecule for molecule basis as is CO2. One methane molecule will absorb 20 times as much infrared
radiation as CO2. Its lifetime is much shorter than carbon dioxide, however, so this partially compensates
for its higher absorption. Methane is also the most rapidly increasing greenhouse gas. The present concentration
of methane, in parts per million by volume (ppm), to be about 1.7 ppm. Sometimes methane concentration is given
in parts per billion by volume (ppb), and then would have a value of 1700 ppb.
Activities such as
rice and cattle production, the mining and use of fossil fuels, and biomass burning are believed to be the cause
of increasing
methane levels in the atmosphere. Added to this list of sources is the termite, which produces measurable quantities
of CH4,
with estimates ranging from 2 to 150 Tg per year.

There has been some debate as to the primary sources of carbon dioxide to the atmosphere. Candidate sources include:
- fossil fuel use
- deforestation
There has been considerable controversy as to which source has contributed more to CO2 in the atmosphere - but there is evidence that we can glean from the Suess effect.
The greenhouse effect predicts significant changes to the earths climate (often referred to as 'global warming').
There is uncertainty about the exact nature of climate change, but we can make predictions about how ecosystems
might change in response to global warming?
* a poleward shift of vegetation by 150 to 550 km and an altitude shift of 150
to 500m.
* Drought sensitive plants will be vulnerable despite the higher C02 levels.
* The composition of ecosystems will change
* Secondary effects through soils, fires, pests and disease may be as great
as direct climatic impacts.
* Geographical position of wetlands will shift.
* Warmer rivers and lakes will affect cool water species
* Permafrost in high latitudes will be reduced
* Coastal ecosystems are particularly at risk
Recent data on Global Warming. Center line represents average temperature over the period.

What about historical context? Did not carbon dioxide concentrations used to be much higher?
The answer is yes - Average global temperatures in the Early Carboniferous Period were hot- approximately 22° C (72° F). However, cooling during the Middle Carboniferous reduced average global temperatures to about 12° C (54° F).
Similarly, atmospheric concentrations of carbon dioxide (CO2) in the Early Carboniferous Period were approximately
1500 ppm (parts per million), but by the Middle Carboniferous had declined to about 350 ppm -- comparable to average
CO2 concentrations today (information from http://www.clearlight.com/~mhieb/WVFossils/Carboniferous_climate.html)
We must take a long-term view of climate: We are actually in an ice age climate today. However for the last 10,000
years or so we have enjoyed a warm but temporary interglacial vacation. We know from geological records like ocean
sediments and ice cores from permanent glaciers that for at least the last 750,000 years interglacial periods happen
at 100,000 year intervals, lasting about 15,000 to 20,000 years before returning to an icehouse climate. We are
currently about 18,000 years into Earth's present interglacial cycle. These cycles have been occurring for at least
the last 2-4 million years, although the Earth has been cooling gradually for the last 30 million years (information
from http://www.clearlight.com/~mhieb/WVFossils/Carboniferous_climate.html). .

So what is the issue today - the rate of change! Consider species responses and evolutionary
limitations.
How are predictions of climate change made? Global Circulation Models (a 3-dimensional atmosphere model, details
provided in class):
Some GCM preditions for temperature and precipitation amounts. From http://www.giss.nasa.gov./

Source: Center for International Earth Science Information Network
How are predictions about ecosystem response to increasing carbon dioxide tested: the 'FACE' (free air CO2 enrichment) experiments.
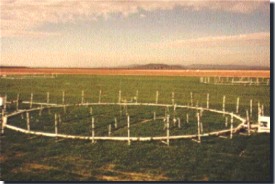
Examples of FACE rings in forest and tundra ecosystems (from Oak Ridge National Laboratory). Recent research results
were published in Science.
If temperature, precipitation and species distribution are linked, how will different ecosystems be affected?
- Forests
- Wetlands/Aquatic Ecosystems
- Agriculture
Another biogeochemical cycle is changing, namely nitrogen, leading to what has been called the "nitrogen saturation"
of ecosystems. Some of the potential consequences include:
Currently the global consumption of fertilizer, chemically fixed', nitrogen is around 80 million tonnes. Compare
that
with the 110-130 million tonnes that isestimated to be fixed naturally and you will see that fertilizer fixation
nearly matches the activities of all those microorganisms in all global ecosystems (from Natural Environmental
Research Council, UK).
But, how well fertilizers work! Consider the following data on wheat yields in response to N additions:

See also the famous Rothamsted Park Grass Experiment.
And finally, some data on the extent of the hypoxic zone in the Gulf of Mexico:

Global Change 3. Changing Land Cover/Land Use
How is the issue characterized?
- humans have altered 1/3 to 1/2 of the earth's ice-free surface
Statistics on changes in land use from 1700 to 1980:
forest -18.7% (amounts to -1162 10^6 ha)
grassland/pasture -1.0% (-72 10^6 ha)
cropland +466.4% (+1236 10^6 ha)
The link between the carbon and nitrogen cycles is highly dependent on the global distribution of land cover. How
does this work?
Web links of interest:
What is land cover
Chesapeake Bay landsat data